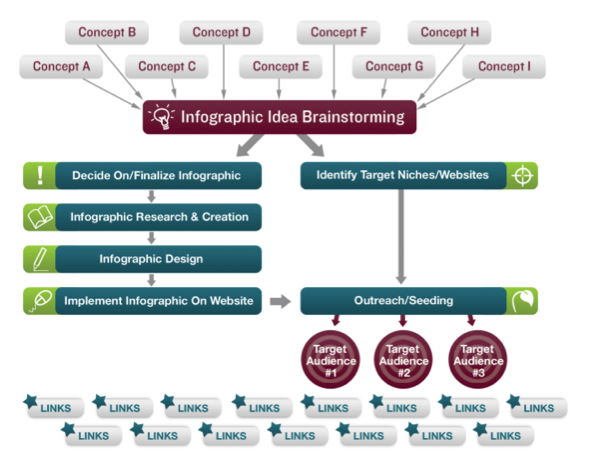
To add the above image to your website, please copy and paste the code below.
Infographics are the embodiment of the old “a picture is worth a thousand words” adage. They are a concentrated form of information that is often easier for people to understand than long, drawn-out text. Infographics consist of some type of image or “graphic” with information written on or around the picture. Infographics normally rely more heavily on pictures than words to convey a message. For example, an infographic might contain a pie chart with minimal labelling and a short blurb explaining the contents. Some infographics contain no text at all beyond labels.
Infographics work well for SEO and drive inbound traffic from others to your site. Creating infographics is a great way to compact a large amount of information into a small space on your website and to engage your readers quickly and visually. More people learn visually than through any other sense, so it is important to reach out to this large population of potential customers or clients.
Because infographics drive traffic to your site, they can help both your organic rankings and your deliberate SEO campaigns. They help with link-building efforts as they are easy for others to point to. You can embed links in your infographics that give you more “bang for your buck” by combining two strategies: link building and content management. Combining these two valuable activities into one process saves you time and money and helps your website visitors have a better user experience.
There are four categories of infographics:
• Educational—teaches something or shares important facts
• Humorous—shares humor through stories, cartoons and other visual modes
• Controversial—challenges thought and begins dialogues about topics
• Newsworthy—reports on important current events
In order to create an infographic, you need information. Your designer will take that information and put it into visual form. This form can be as creative as you like; in fact, the more creative your infographics the more likely visitors will pay attention to them. Finally, you must market your infographic through one or more websites or platforms.
PR can be one of the most important steps in this process. No matter how good your infographic is, it does not matter if no one sees it. There are services that promote infographics by embedding a simple code that can be copied and pasted onto another website with a link back to the original source. This is “free” SEO, driving traffic to your site.
Press releases are a good way to market your infographic, but the personal touch is always valuable as well. Identify lists of bloggers, writers, and others who will benefit from the information and share it with them. You can also use social media such as Twitter and Facebook to get your infographic to the public.
Orange County SEO can help you build and market useful and interesting infographics that will reach your targeted audience quickly and effectively. Contact us at Orange County SEO today to learn how easy it is to incorporate great infographics into your website.

